
Industries & Solution Applications

Transport & Fleets

Operational Challenge, Approach, Measurement and Value

km/lL/100 km

The asset base is fixed in the short term, fuel can be a major controllable operating cost, and the improvement has to be proved in the client's own operating environment before it can be scaled.

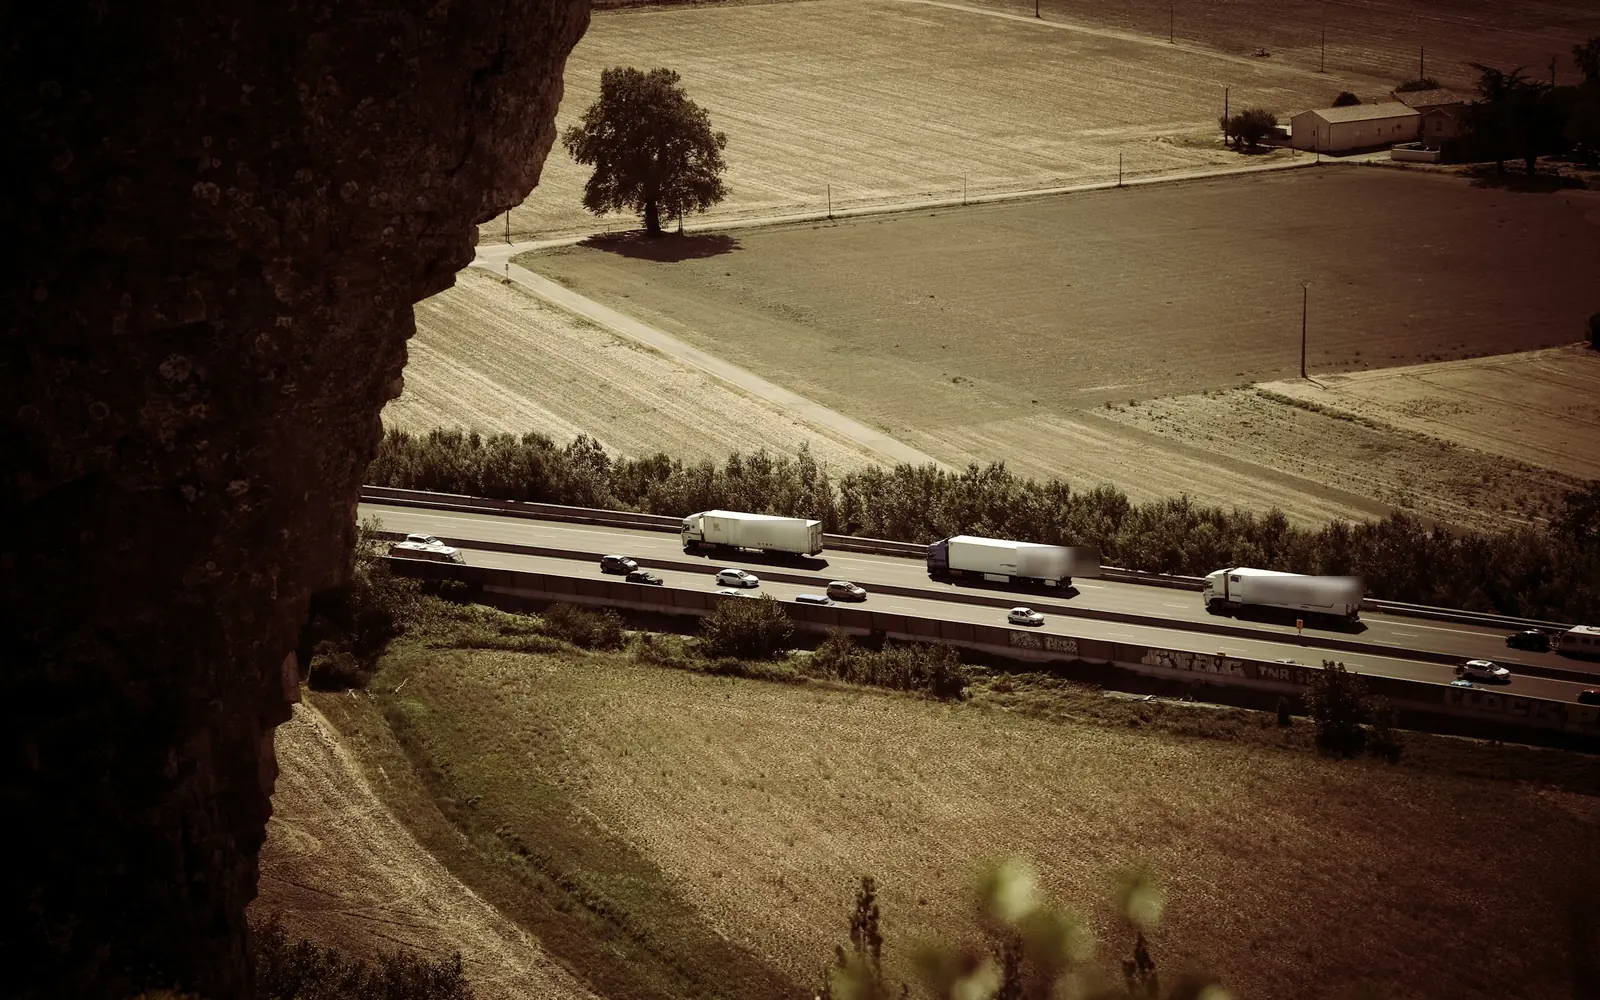
Commercial trucks on a highway

Illustrative visualisation. Not a depiction of any specific facility or customer operation.

Operational challenge

Fuel cost across distributed fleets with variable routes, loads and driver behaviour.

Transport & Fleets

Decarb Matrix approach

Fleet baseline, representative vehicle selection, controlled trial and consumption measurement.

  1. 01 Fleet baseline
  2. 02 Representative vehicle selection
  3. 03 Controlled trial and consumption measurement

Proof

Measured Results on Record

Selected results from customer operations, quoted exactly as recorded.

Transport & Fleets DeCarb Diesel Plus

5.80 km/L

average mileage, against a 5.40 km/L depot average

Average mileage, km/L
Depot average5.40 km/L
Five trial buses5.80 km/L
  • Five buses
  • 42,412 km
  • October–November

Across five state transport buses (42,412 km), average mileage was 5.80 km/L with DeCarb Diesel Plus (tested as Diesel Plus Gold) against a 5.40 km/L depot average for October–November.

Results are specific to the equipment, period and method recorded, and are not a guarantee for other operations.

Measurement

What we measure

Value is established for one operation at a time. Consumption and performance data are measured against baseline using the method agreed before the trial.

  • Kilometres per litre
  • Litres per 100 km
  • Fuel per vehicle
  • Distance operated

Potential business value

Fuel-performance and operating-cost opportunity where verified.

Sector-specific business-value assessments can be developed from the client's own operating baseline and verified performance data.

Relevant DeCarb product

DeCarb Diesel Plus / DeCarb Petrol Plus

Transport & Fleets

Sector-wise Calculator

Work out annual fuel from how your sector measures it, then take the figure to the Business-Value Assessment. Every result is an Illustrative Opportunity Estimate.

The calculator needs JavaScript switched on in your browser.

Optional. There is no default. Enter your own scenario between 0.1% and 50%.

%

Optional. Add your delivered price to see fuel spend and fuel-cost impact.

₹per litre

Transport & Fleets

Enter your baseline and annual activity to see annual fuel use.

Annual fuel consumption
— litres / year
—
Annualised Fuel Reduction Your assumption
— litres / year
Annual fuel × improvement %
Annual fuel spend
₹— per year
Annual fuel × fuel price
Estimated annual fuel-cost impact
₹— per year
Annualised fuel reduction × fuel price

What we measure

Kilometres per litre, litres per 100 km, fuel per vehicle, distance operated.

Relevant DeCarb product

DeCarb Diesel Plus / DeCarb Petrol Plus

Product relevance is established by technical evaluation of fuel grade, equipment category, duty cycle and operating conditions, not by sector alone.

Illustrative Opportunity Estimate — not a performance commitment. Actual performance must be established through your own baseline and controlled trial.

Opens the Business-Value Assessment with your annual fuel figure, ready for your fuel price.

Industries

Industries & Solution Applications

Start here

Start with a Measurable Opportunity

From baseline to measurable business value. Start with Assessment. Scale on Evidence.

Request an Assessment Find Where to Buy